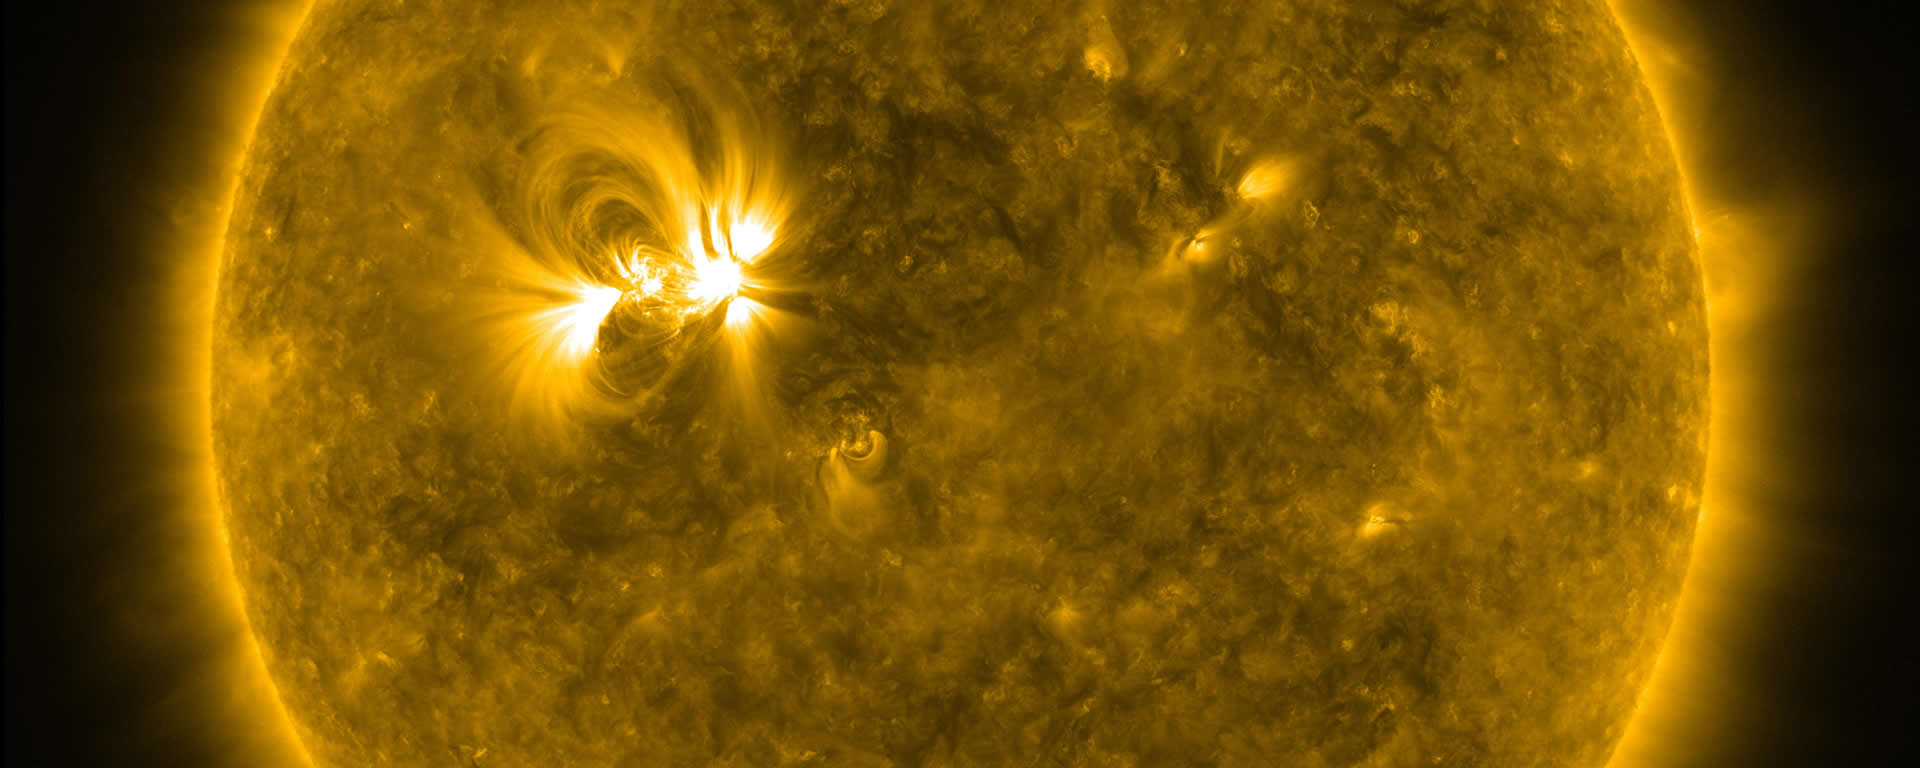
SDOBenchmark is a machine learning image dataset for the prediction of solar flares.
Solar flares are intense bursts of radiation which can disrupt the power grids of a continent, shut down the GPS system or
irradiate people exposed in space.
Developing systems for predicting solar flares would allow us to precisely aim our
observation instruments at upcoming events, and eventually enable countermeasures against such worst-case scenarios.
Dataset
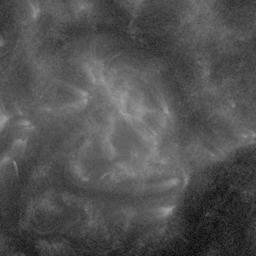
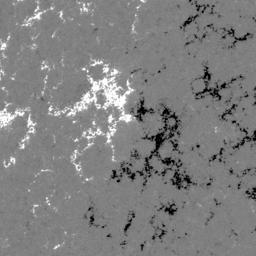
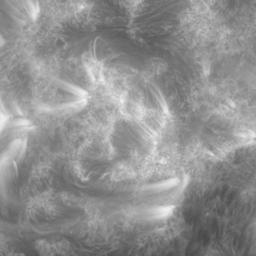
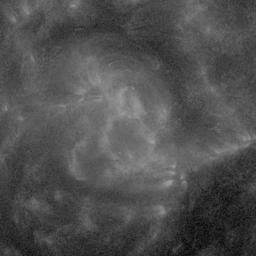
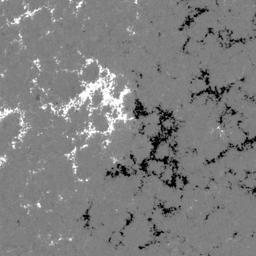
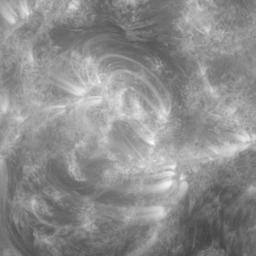
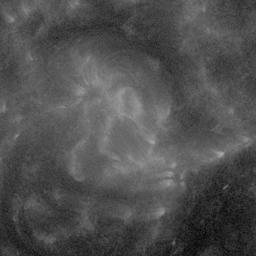
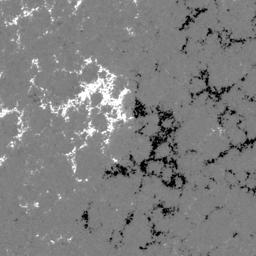
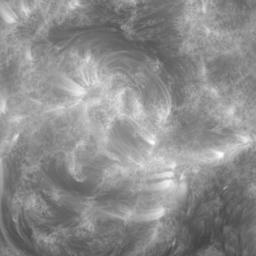
In the SDOBenchmark dataset, each sample consists of 4 time steps (→) with 10 images (↓, 1,2...10):
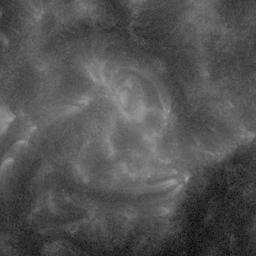
AIA wavelength 131
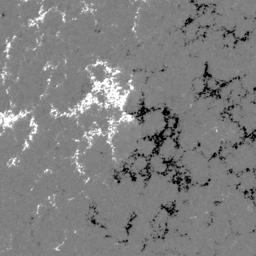
HMI magnetogram
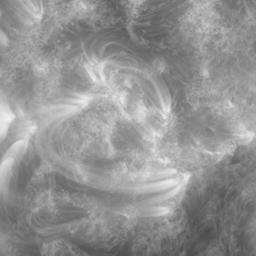
AIA wavelength 171
AIA wavelength 131
HMI magnetogram
AIA wavelength 171
AIA wavelength 131
HMI magnetogram
AIA wavelength 171
AIA wavelength 131
HMI magnetogram
AIA wavelength 171
- 256x256 px JPEG
- coming from 2 detectors onboard the SDO satellite: 8 from AIA, 2 from HMI
- Missing images in many samples
- the peak emission ("flux") of the sun
- within 24h
- 1e-9 = "quiet sun"
- 1e-3 = largest flare in a decade
The dataset comes with 8'336 training samples and 886 test samples.
Evaluation metric
We use the mean absolute error as a performance metric for this dataset.
Hints and tipps about the data
The data has gaps, but it's reasonably stable
- The label peak_flux is quite stable according to the manual labeling of experts (see HEK vs GOES)
- The data went through plenty of verification in code (e.g. here or here)
The data is not stationary
- There exists a nearly periodic 11-year solar activity cycle.
- Several detectors experience a decay in functionality over the years in operation. Their images get darker and darker over time. (See e.g. this GitHub issues discussion)
The data is imbalanced
..but the mean absolute error takes care of that for you in this case (the FAQ explains why).
The data analyis gives
a rough idea of the imbalance by counting the binned emissions.
FAQ
- SDO is a satellite mission which is orbiting around earth
- AIA and HMI are two instruments on SDO that record the activities of the sun
While SDO has been observing the Sun since 2010, we're using data from 2012 onward.
- Sample complexity: A single sample is a collection of images over four time steps
- Not many samples
- Regression problem
The easy answer is that we can't artificially produce or simulate more flares. But there is also
a strategic choice behind it:
Imagine you have to train a network to recognize cats. We'd give you a training set of 10 million
images, recorded by cameras around our neighbourhood. While 10 million images is a great size
for deep learning, you'd soon come to realize that all our images are from the same 100 cats. As a
consequence, your model would overfit heavily and just recognize those 100 cats e.g. by some specific
individual features. That's why we chose to preselect only a few of the most different images per cat.
The same is true for our images of Active Regions. It would learn to recognize these patches of the sun,
and then "look up" in its neurons whether this specific patch will flare or not flare.
(This is also the reason why we have to make sure to have different cats / Active Regions in the training
and test sets. Simply selecting images randomly would not be sufficient.)
Due to the logarithmic nature of the label peak_flux, the mean absolute error weighs errors with strong activities
much higher than in calm or low activities. While this correlates with our intentions, the data imbalance
helps to rebalance the otherwise predominant strong flare predictions to some degree.
Further, while there are plenty of norms around, the mean absolute error is simple and exists out of the box in practically
all machine learning frameworks.
Other standard metrics (e.g. mean squared error) have less desireable characteristics for this prediction problem.
Creating a solar flare prediction dataset requires a lot of domain knowledge and time. By providing an already existing dataset we hope to encourage machine learners to push the envelope of solar flare predictions. We therefore put a lot of effort into providing both great accessibility and high scientific quality.
Currently, it is still unknown how well models will perform on this dataset. Our goal is to create a benchmark as simple as
possible, yet without sacrificing scientific value.
We will gladly provide a more difficult prediction problem at a later stage.
Except for vertical flipping (upside down), I claim that all data augmentation will alter the underlying physics.
When you flip the images horizontally, the solar rotation, the perspective distortions and the spherical
projection remain the same. And there is no known difference between Active Regions in the upper and
the lower hemispheres of the sun.
Horizontal flipping will make the Sun rotate in the other direction. It can work though if you process the images
individually.
As for random cropping, keep in mind that you might run into the same issue as mentioned in
"Why are there so few training samples?".
You can find existing Jupyter notebooks on the SDOBenchmark GitHub repository or in the Kaggle dataset entry.
On the SDOBenchmark GitHub issues page.
Current state
... for this dataset
| name | author | mae | TSS | HSS |
| Fixed point baseline | Roman Bolzern | 1.53e-5 | 0.0 | ? |
| First competitive model | Roman Bolzern | 3.6e-5 | 0.45 | ? |
... for solar flare prediction in general
A nonextensive list of examples are:- Plenty of manual forecasts, many of them listed here
- The 24h prediction of solar monitor at solarmonitor.org
- Prediction of solar flares using signatures of magnetic field images
- Flare Prediction Using Photospheric and Coronal Image Data
- A RandomForest applied on HMI data (Arxiv here)
- Solar Flare Prediction using Multivariate Time Series Decision Trees
- Flarecast.eu, a flare forecasting framework
- Flarenet, a framework built for helping deep learning researchers to faciliate creating a dataset similar to this one (Paper here)